
It seems that no one of consequence is doing anything about the issue of greatest consequence.
|
Listen To This Story
 |
How much of the current economy would you sacrifice to prevent the future economy from complete collapse?
This is your regular reminder that no one of consequence is doing anything about the issue of most consequence. Consider the three graphs presented here.
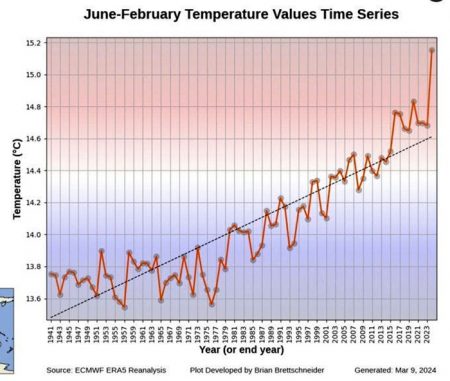
Global Temperature Rise
The first (above) shows year-by-year global temperatures since 1941 (source here). The black line shows the trend line for the entire chart. Does that look like acceleration to you?
Atlantic Ocean Sea Surface Temperature
Now consider the chart below (source here). It shows surface temperature in the Atlantic Ocean from January 1940 through February 2024.
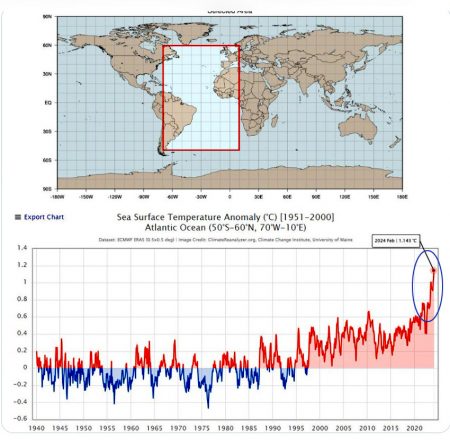
If the segment from 2020 to now (circled in blue on the far right) doesn’t look like acceleration, your optician may need to check your prescription.
Total Energy Imbalance
Here’s related data. It shows the overall “energy imbalance” — energy in minus energy out — averaged over the whole of the planet. (The source is here.)
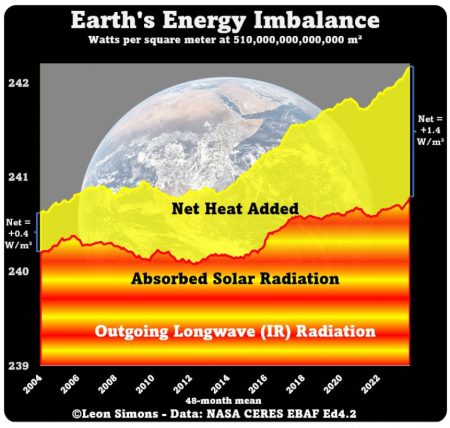
The timeline (X-axis) for this chart is restricted to just the last 10 years. The area under the top yellow line shows “Absorbed Solar Radiation” (energy in). The area under the lower red line shows “Outgoing Radiation” (energy out).
The difference, the area between the two lines in pure yellow, is net radiation, energy in less energy out, in this case heat retained by the planet.
Starting around 2014, energy in, the yellow line, starts climbing, while around 2017, outgoing radiation, the red line, flattens. The result is an increase in energy retained. This is clear from the chart. Note that the yellow area noticeably increases, grows fatter.
World GNP — the economic sum of global economic activity — topped $100 trillion in 2022.
What will be the sum of global economic activity after the population is reduced to a tenth and almost everyone is pre-agricultural?
In 2004, energy retained across the entire planetary surface averaged +0.4 W/m2 (Watts per square meter). Just 10 years later, energy retained rose to +1.4 W/m2, a three-fold increase. New heat is being added at an accelerating rate.
Post-Climate GNP
World GNP — the economic sum of global economic activity — topped $100 trillion in 2022.
What will be the sum of global economic activity after the population is reduced to a tenth or less and almost everyone is tribal and pre-agricultural? Zero, perhaps?
So, how much of the current economy would you sacrifice to prevent the future economy from complete collapse?
The answer, if one is a cynic, may depend on whether the “you” answering this question thinks the collapse will come during that person’s lifetime or after it.
The conventional wisdom is that the global climate crisis will come later this century. Is this why no one of consequence is doing anything about the issue of most consequence? Because the crisis will be someone else’s problem?
If this is what they think, why keep them in charge?
Published with the permission of Thomas Neuburger. A version of this piece originally appeared in his newsletter “God’s Spies.”


