
It’s hard to know whether to view this election’s unanticipated polling accuracy as an encouraging or unsettling development.
|
Listen To This Story
 |
What’s the biggest conundrum of the 2022 election? The polls — with a couple of strange exceptions I’ll get to — were accurate but the pundits were virtually all wrong.
The pundits all had access to the polls — they didn’t believe them. Then they were taken completely on the hop when the big “red wave” — not predicted by the polls — turned into the pink ripple that it was.
What is this all about? What’s going on with our polls, our elections, and our pundits?
To begin to answer this question, we’re going to have to delve a bit into the backstory: How the relationship between polling and elections has evolved over the past several decades.
It’s not entirely clear how accurate polling, and especially exit polling, was in the good old days when vote counts rolled up almost mechanically on the screen behind Walter Cronkite or David Brinkley. It was simply not a hot enough issue then to spawn much reliable research.
But we know that the networks made a “gentleman’s agreement” to withhold exit poll-based calls until polls had closed because early calls — which were trusted because they virtually all turned out to be accurate — dampened late turnout. So we know that exit polls were reliable for calling the winners of even tight races.
What we don’t know for sure is how accurate they were in numerical terms — how close to the ultimate vote shares. That’s because, when we look back at exit poll archives from before 2002, we see very good approximations of vote shares — but we have no clue as to whether or not the spot-on exit poll numbers we are viewing were adjusted to near congruence with the vote shares as the votes were being counted and the actual returns became available. The polling poobahs are famously tight-lipped and I’ve never been able to get a straight answer to that question.
What we do know is that, after 2000, both pre-election and exit polls began to exhibit a consistent one-way inaccuracy, so that vote counts in many contests — especially competitive contests bearing national significance — began coming out to the right of the polls, a phenomenon I dubbed the “red shift” (a term now in common usage).
While adjusted exit polls continued to be “accurate” (because they were adjusted for accuracy), the exit polls first publicly posted (as well as pre-election polling, which began to be aggregated by outfits like FiveThirtyEight and Real Clear Politics) began an era of being “off” — virtually always to the left of election results.
We know about the exit polls because we screen-capture those first public postings before they disappear forever, giving way to successive adjustments toward congruence with the vote counts (interestingly, the exit polls posted for last week’s election do not appear to have been subject to the traditional adjustment process).
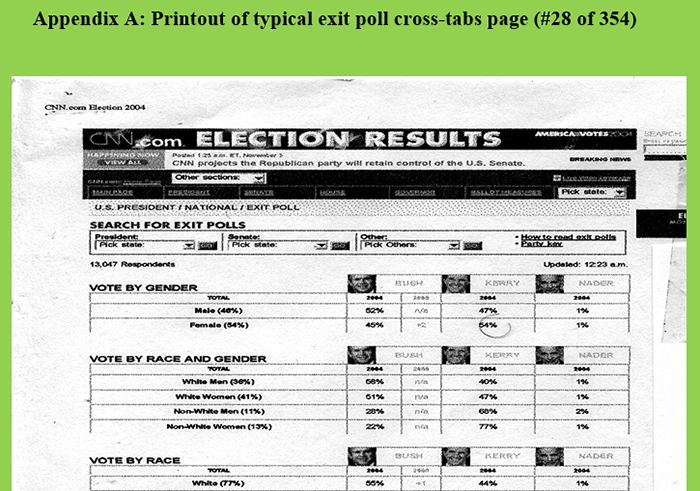
I was, to my knowledge, the first person to undertake this task, printing out and publishing hundreds of pages of unadjusted exit poll data on election night in 2004 — much to the chagrin of Warren Mitofsky, the “father” of exit polling, who was obliged to issue a long and unpersuasive report attempting to explain how it was his polls that had failed.
The pervasive red-shift disparity became a major headache for pollsters — both the exit pollsters who provided the networks with such valuable information and the pre-election pollsters whose polls fed predictions of how the country would swing. What was the point of polls that were always “off” and what was wrong with polls that were always off in the same direction?
So “corrections” had to be found and, a few years after the 2004 debacle, the Gallup polling organization came up with a very promising tweak for pre-election (aka tracking) polls: The “Likely Voter Cutoff Model” (LVCM). What the LVCM did was to attempt to screen out nonvoters whose survey responses would distort the polling numbers because they would not in fact turn out to be part of the electorate.
That seems to make sense but the LVCM actually wound up operating as a right-skewing, tunable fudge factor. Why? Because it relied on a series of screening questions like “Have you voted in the last three elections?” and “How long have you lived at your current residence?” These questions screened out voters who skipped the midterms (we know Democratic turnout has traditionally fallen off more than Republican turnout in midterm elections), renters and transients, urban dwellers, and young voters.
In other words, it disproportionately eliminated from the sample more Democratic constituencies and potential voters. Moreover, depending on the precise questions and the “score” you needed to qualify for the sample, the LVCM could be tuned to kick out whatever portion of such voters the pollster thought would be needed to get their polls to be accurate.
And it worked! But it shouldn’t have. Because the LVCM was clearly a distortion: Many if not most of the voters eliminated from the poll sample — those not deemed “likely” voters — would in fact go on to cast ballots but would not be represented in the poll. And most of those eliminated voters were Democrats. So the polls should have started coming out to the right of election results — but they didn’t; they got more accurate. In fact, for a time, the most accurate of the pollsters was Rasmussen, which used the most stringent screening and weeded out the most Democratic voters.
And exit polls — which prided themselves on representing only actual voters — also wound up being tweaked to the right. Exit polls rely on a weighting process based on the pollsters’ best estimate of the demographic makeup of a given election’s electorate. We know that, beginning no later than 2004, those demographics were based on the adjusted results of prior exit polls. And since those adjustments were pretty much invariably to the right, the current exit poll would impound that rightward nudge, much like the pre-election polls tweaked by the LVCM.
The pollsters did this not out of malice or as their part in some grand conspiracy, but rather simply to compete in their field and stay in business. Woe to the pollster who keeps getting elections “wrong” (in the same direction, no less) while their cohorts are getting them “right.” And that is the pollsters’ job as they see it: To get elections right, not to stubbornly stick to sound but failing methodologies so as to act as a check mechanism on suspect elections. At least not in this country — polls are relied upon for just this purpose, including by the US government, in elections taking place abroad.
This is the essence of the “poll-vote feedback loop.” We know that polls have an impact upon elections (that’s why our email boxes are bombarded in the months leading up to an election by candidates, parties, and advocacy groups all citing the latest polling numbers — and trends — as the centerpiece of their appeals for support) and we also see from the above that elections have impact upon polls.
Which brings us to the 2022 election and the unanticipated and mysterious accuracy of the polls. Just how accurate were the polls? Well, some votes are still being counted but we can provide some general answers. For the 15 most competitive governor’s races, the final FiveThirtyEight predictions of vote-count margins missed by an average of 0.2 percent and the exit polls for the eight races of the 15 that were exit polled missed by an average of 0.5 percent. That is spectacular accuracy by recent standards — and the two sets of polls’ tiny misses were in opposite directions, so there was just about no overall shift, red or blue.
For the 12 most competitive Senate races (nine of which were exit-polled), the performance was only slightly less impressive: FiveThirtyEight’s aggregate was off by 1.0 percent and the exit polls by 1.1 percent, both yielding unprecedented blue shifts. Compare that with 2020, when for the 14 most competitive Senate races (of which 11 were exit polled) the pre-election polls missed by a whopping 5.3 percent and the exit polls were even worse, a 6.1 percent miss — both red shifts being typical of the elections in the past 20 years, the computerized voting era.
It’s hard to know whether to view this unanticipated 2022 polling accuracy as an encouraging or unsettling development. Pollsters have been trying — and mostly failing — to “get it right” for two decades (in 2002, the exit polls were so far off that they were never publicly posted and abandoned by the networks in their election night coverage and calls), and finally managed to “catch up” to the voters. What could be wrong with that?
In a rare moment of MSM candor on this subject, Philip Bump, analyst extraordinaire at The Washington Post, last week shed light on the how the pollsters finally pulled it off:
How do accurate polls result in a surprising election result? Because the elections in 2016 and 2020 have instilled a near-expectation that the polls are going to be off — and presumably to the GOP’s advantage [i.e., the actual vote would shift to the GOP]…
[So] there were … systemic efforts this year to adjust polls to reflect that expected Democratic bias.
That is, there were additional systemic efforts — over and beyond the LVCM and other existing systemic efforts — to deal with that pesky “Democratic bias” of the polls. Efforts that seem to have worked like a charm. Bump goes on to explain:
Those of us who’ve been around for a while saw this precisely one decade ago. Then, polling showing President Barack Obama faring well was “unskewed” to better reflect the expected strength of Mitt Romney. That strength didn’t materialize, and “unskewing” was revealed to be a bad idea — at least for a while.
RealClearPolitics, which has traditionally had a straightforward average of polls, introduced an effort to adjust polling to reflect perceived anti-GOP shifts. Perhaps because of that expectation that polls were overestimating Democrats, Tom Bevan, co-founder of the site, publicly challenged The Economist’s G. Elliott Morris’s presentation that the Senate was a true toss-up. Which, of course, it was.
All this is not easy to unpack but what it boils down to is this: The 2012 election was a weird outlier (a deep dive into what went down is presented in my book CODE RED) that spooked the pollsters because it didn’t live up to the rightward tweak they had built into their polls. But then came 2016 and 2020 to restore their faith that, for some reason, their samples included too many Democratic voters, so they reverted to form and for 2022 made their “systemic efforts to adjust” their polls.
What’s lost in all this, of course, is the rock-solid assumption that the entirety of every disparity between polls and vote counts is the result of polling error, not erroneous or fraudulent vote counts or other thumbs on the electoral scales. With the types of tabulation and levels of verification (i.e., existing audit protocols as actually practiced) that have prevailed throughout the computerized voting era — and continue to prevail — we have, at best, an inadequate basis for being so sure of that.
What if systemic efforts to adjust the polls worked this year because they succeeded in mirroring systemic efforts to “adjust” the vote counts? I’m aware that this has the ring of a very “Stop the Steal” kind of question. And aware too that such questions are, in the wake of Stop the Steal, now more than ever anathema.

Does this mean we should stop asking them, stop holding our electoral process to a standard of transparency and credibility that would, if we were designing such a process from scratch, be a no-brainer?
And what of those few places where the polls — “systemically adjusted” as they were — nevertheless missed badly? What of Florida, for example, where the results for the Senate race were red-shifted by 5.6 percent and 8.1 percent from the exit and pre-election polls respectively; and the results of the governor’s race by 6.1 percent and 7.8 percent? (For that matter, what of New Hampshire’s Senate race, which saw blue shifts of nearly the same magnitudes?)
These are enormous misses, far outside the polls’ error margins. They are also typical of the many egregious misses we’ve documented over the past two decades of computerized voting. Can we even ask whether it’s all polling error (in the case of Florida, in spite of the pro-GOP tweaks; in New Hampshire perhaps because of them) or whether there may have been unaccounted-for thumbs on the electoral scales (Florida being an historically thumby state) that contributed to the massive disparities?
Here’s the rub. The still not quite decided balance of political power notwithstanding, most of America is breathing a sigh of relief because this election didn’t go BOOM. All but a very few losing candidates conceded; all but one of the election-denier candidates for secretary of state were defeated; there was little of the feared violence; the guardrails held; and even the polls — in spite of all the skepticism from the punditry — got it right. Democracy lives!
Who wants to be the turd in that punchbowl? Who dares to observe that our electoral process remains vulnerable to both undetected manipulation and baseless challenge — to warn that this time bomb is still ticking?


