WhoWhatWhy has compiled a data-driven Elections Report Card that looks at different factors — from the fairness of districts and the process of drawing them to the enactment of voter suppression laws, the ease of voting, and opportunities to directly participate in democracy. If you're curious how democracy is thriving — or dying — where you live, visit our report and interactive map to learn more.
|
Listen To This Story
 |
Americans are deeply concerned about the state of US democracy. According to a recent poll, two-thirds of them believe it is in danger of collapse.
They are not wrong.
After another round of redistricting and gerrymandering, congressional districts have become less competitive than ever, as both parties try to give themselves an advantage. Since 2020, many states have enacted laws that make voting more difficult.
The last presidential election also gave us “fake electors” and an attack on the Capitol as Congress was getting ready to count the Electoral College vote.
In addition, while many states have mechanisms in place that give Americans an opportunity to vote on issues directly, the will of the people expressed in these ballot initiatives is then frequently ignored or overturned by state governments.
All of this comes on top of a system that disproportionately favors small states over more populous ones — when it comes to both presidential elections and representation in Congress.
It is not surprising, then, that Americans are feeling gloomy about democracy. For most of them, however, their views are primarily based on the information (and sometimes misinformation) they get from traditional and social media. A lot of this is anecdotal evidence and not empirical data.
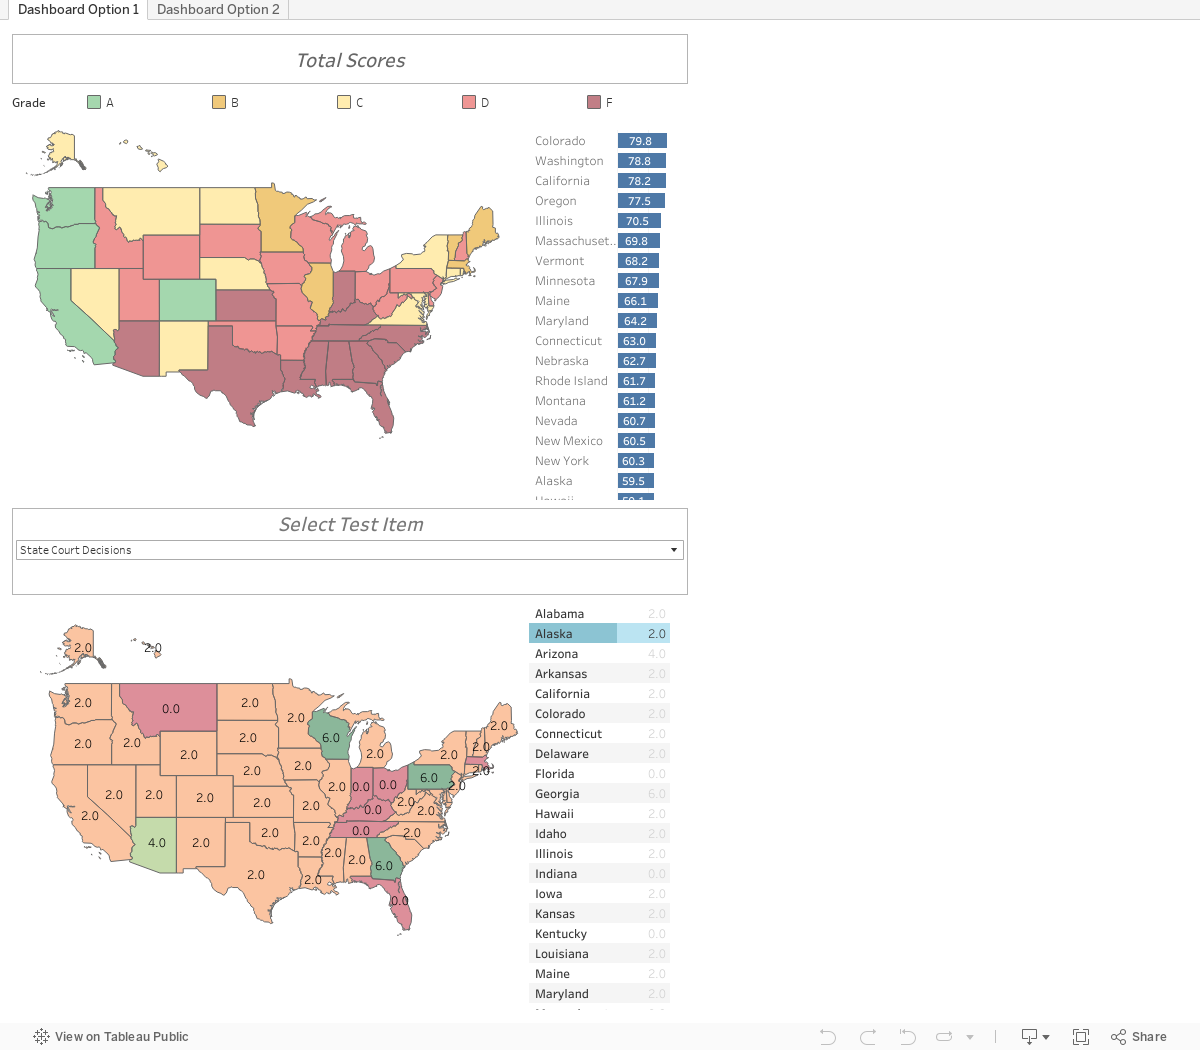
That is why, for the first time ever, WhoWhatWhy has compiled a data-driven Elections Report Card that looks at different factors — from the fairness of districts and the process of drawing them to the enactment of voter suppression laws, the ease of voting, and opportunities to directly participate in democracy.
Overall, there are 12 categories (containing 43 individual metrics) that, when viewed together, provide an accurate, fact-based story of how all 50 states are doing.
Not surprisingly, many of them are not faring well.
So how is democracy doing where you live? Check out the map below and find out.
You can view the data we used when calculating individual state grades here.
You can read about our methodology and a detailed report of our conclusions here.


