
EXCLUSIVE: COVID-19 Surge Fuels Impending ICU Crisis in 3 States That Opened Early
Disease Models Now Project More Than 200,000 US Fatalities by October
COVID-19 cases surge as states prematurely abandon preventive measures.
With COVID-19 cases spiking again in many parts of the US, an exclusive data analysis by WhoWhatWhy shows that three states which reopened earliest — Florida, Texas, and Georgia — are facing a surge of patients that could overwhelm intensive care units within weeks.
A worst-case projection shows Florida running out of ICU beds by July 21. Texas is setting record highs for new cases, and already has the most hospitalized COVID patients — more than 2,500 — since the outbreak began. In Georgia, cases are increasing by one-third every two weeks, and projections show the state’s 590 ICU beds filled by July 27 at best — or the end of June, at worst.
This “reopening surge” has alarming implications for the entire country. The Institute for Health Metrics and Evaluation (IHME) at the University of Washington now predicts a sharply increased death toll in coming months, with total COVID deaths nationwide rising from 114,388 as of Monday to at least 135,000 by mid-July and more than 200,000 by October 1.
Florida could be one of the hardest-hit states, with 18,675 deaths projected by October 1, almost double the estimate from a week ago. Intensive care units in Florida’s hospitals are already facing overload.
At Broward Health Medical Center in Fort Lauderdale, for example, only 15 percent of ICU beds were available Sunday — half as many as two weeks ago, according to the South Florida Sun-Sentinel. The entire state, with more than 21 million residents, now has only 1,655 open ICU beds. According to IHME, current projections show Florida running out of beds by September, but if the rate of infection increases, capacity could be exhausted as soon as July 21.
State elected officials have been reluctant to accept — or report — bad news. As WhoWhatWhy reported, Florida Department of Health employee Rebekah Jones was fired May 18 for refusing to alter a data “report card” to give the false impression that more counties were ready for reopening. She has since launched a Florida dashboard of her own, FloridaCOVIDAction.com.
Most of Florida moved into the second of the state’s three-phase reopening plan on June 5. The exceptions were the hardest-hit areas in Miami-Dade, Broward, and Palm Beach counties. In most of the rest of the state, bars, movie theaters, and bowling alleys were allowed to operate at 50 percent capacity, and tattoo shops, massage parlors, and tanning salons also received a green light.
“It’s really, really important to continue to avoid crowds and continue to limit the risk of exposure,” Gov. Ron DeSantis (R) said at the time. The following week, however, the Republican National Committee accepted DeSantis’s invitation to hold its national convention in August in Jacksonville, Florida’s largest city. Officials in North Carolina had feuded with President Trump about the safety of gathering more than 50,000 expected participants in Charlotte, the original host city.
Florida has also cleared the way for its popular theme parks to start reopening, including Universal Studios, SeaWorld Orlando, and Busch Gardens in June, and the Disney parks by mid-July.
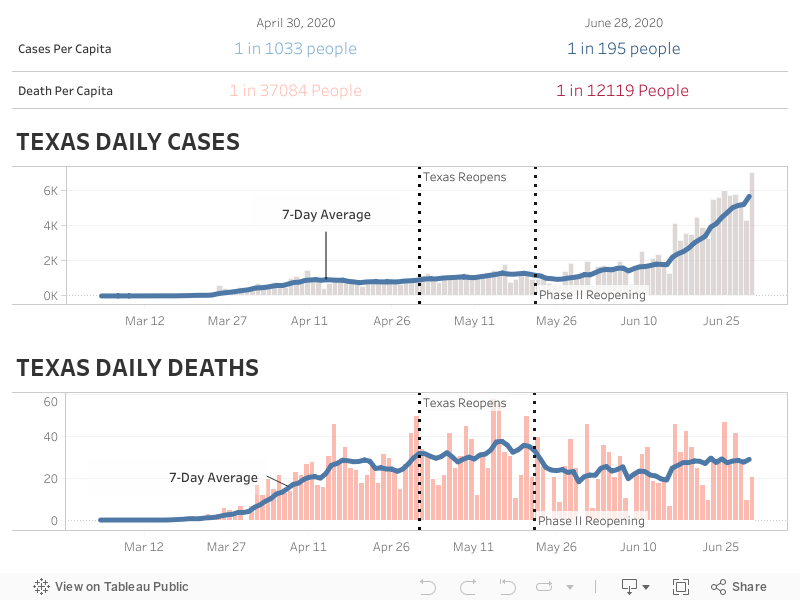
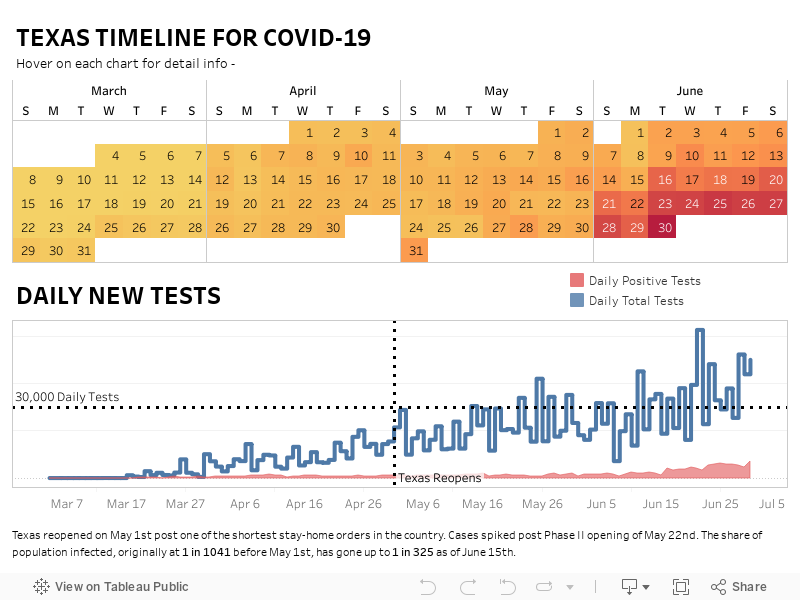
Despite pushback from some local officials (including Harris County Judge Lina Hidalgo, whose order for people to wear face masks was overruled by the governor), Texas — the second most populous state — went from total lockdown April 30 to being almost entirely reopened by the end of May.
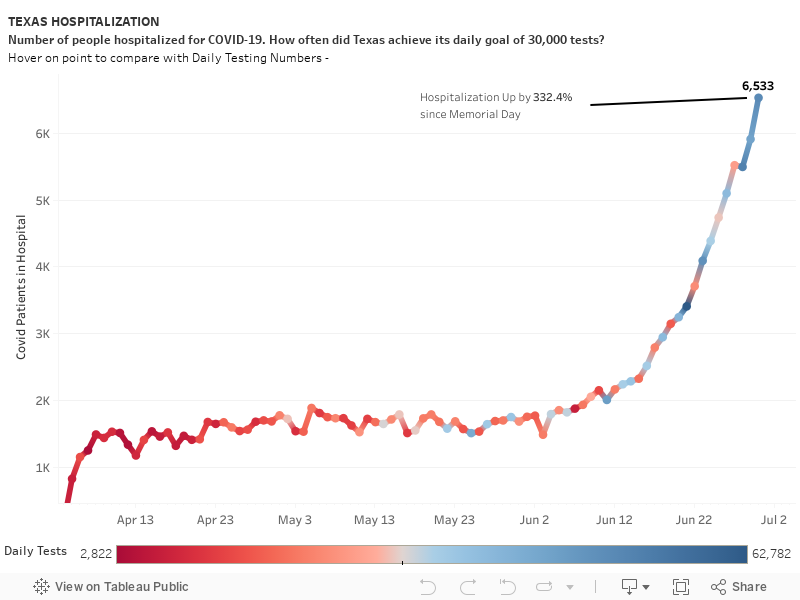
On June 10, 11, and 12, new cases in Texas set record highs, with more than 1,800 new cases reported each day. The number of new COVID-19 hospitalized patients — more than 2,500 on Tuesday — is the highest since the outbreak began.
On April 28, Gov. Greg Abbott (R) had issued an executive order requiring hospitals to reserve 15 percent of their ICU beds for COVID patients, and in the Texas Medical Center, almost all of those — 14 percent — are now occupied. At the rate hospitalization is surging, according to WhoWhatWhy analysis, reserved ICU beds statewide will be full within five to six weeks. That will force hospitals to make life-or-death decisions about which patients can be admitted to intensive care wards.
If that is not bad enough, Texas authorities are being forced to make decisions with insufficient data. When Gov. Abbott announced reopening would begin April 30, he said the goal was to test 30,000 people every day. In the 45 days since then, Texas has reached that target only nine times. The ratio of positive tests is considered a key indicator of the virus’s progression, but testing in Texas has obviously fallen short.
Georgia has only one-third of Texas’s population, but on June 15 the Peach State reported almost as many new COVID deaths — 733. CovidExitStrategy.org, which models hospital bed use, says Georgia is at 25 percent capacity — “low availability” — for ICU beds, while cases are increasing by 32 percent every 14 days. IHME projects that all 590 ICU beds in Georgia will be occupied by July 27, or by the end of June in a worst-case scenario.
Meanwhile, Gov. Brian Kemp (R) announced that starting Tuesday, restaurants would no longer need to limit occupancy, and servers would only be required to wear masks when serving customers. Starting June 12, bars were allowed to increase occupancy from 25 to 50 percent capacity. If the relaxed rules increase COVID transmission, hospitalizations in Georgia are likely to increase rapidly.
Statistical models present a bleak forecast for COVID’s deadly impact in many states during the next month. An MIT model projects that the death toll could triple in Arizona by July 15. It could double in California, Texas, Florida, Alabama, and North Carolina, and increase 1.5 times in South Carolina, Mississippi, and Missouri. All told, these gloomy numbers show that in five of the country’s largest seven states, numbers for COVID-19 diagnoses and deaths will be catastrophic.
Note: All visualizations were created for WhoWhatWhy by Pratyush Painuly. All data visualizations are interactive. Hover over the charts for more detailed data.
About the Models and Data cited in this article:
Each model referred to in the WhoWhatWhy analysis tracks various metrics of the coronavirus spread, such as the rate of infection and time period from infection to death based on varying statistical measures. The assumptions made by each model differ with the metrics that are being tracked, such as change in mobility and change in policies issued to combat the spread of infection. Understanding these assumptions and metrics is important for using them, as well as for the uncertainty factor for each model. Uncertainty exists because all the models assume that current policies and mobility patterns will remain constant until cases start to drop.
Below are the models we track as they are updated:
IHME — The Institute for Health Metrics and Evaluation (IHME) is an independent global health research center at the University of Washington. The model utilizes location data and current social distancing rules to estimate the contact between people in a certain area. The model analyzes data that fluctuates substantially, to make more accurate predictions for locations with smaller epidemics.
MIT — The model focuses mainly on hospitals and policy makers in the US. It aims to predict for the near future and assumes that current social distancing will remain constant.
Los Alamos — The Probabilistic model produces forecasts, instead of projections. It assumes that there will be interventions — such as changes in social distancing rules — but does not strongly model the effects of those interventions. The model also allows for the transmission rate to go up.
University of Texas, Austin — The model utilizes local GPS mobile-phone data to quantify social distancing measures. It assumes that mobility won’t vary from the previous week.
Note about our data:
Our daily state-level COVID-19 data is sourced from The COVID Tracking Project and Johns Hopkins University. We also refer to the US Centers for Disease Control, as well as the health departments of each state, to analyze trends relating to hospital and health data. Visualizations created by WhoWhatWhy Data Team.
All visualizations were created for WhoWhatWhy by Pratyush Painuly. All data visualizations are interactive. Hover over the charts for more detailed data.
Jordan Wren also contributed to this article.
Related front page panorama photo credit: Adapted by WhoWhatWhy from Cayobo / Flickr (CC BY 2.0) and Yuki Naotori / Flickr (CC BY-NC-SA 2.0).


