Our report and interactive map paint a bleak picture for election integrity across America.
|
Listen To This Story
 |
Houston, and Phoenix and Fayetteville and Macon and Columbus and Bucks and Berks and Buffalo… and, well, America — we have a problem.
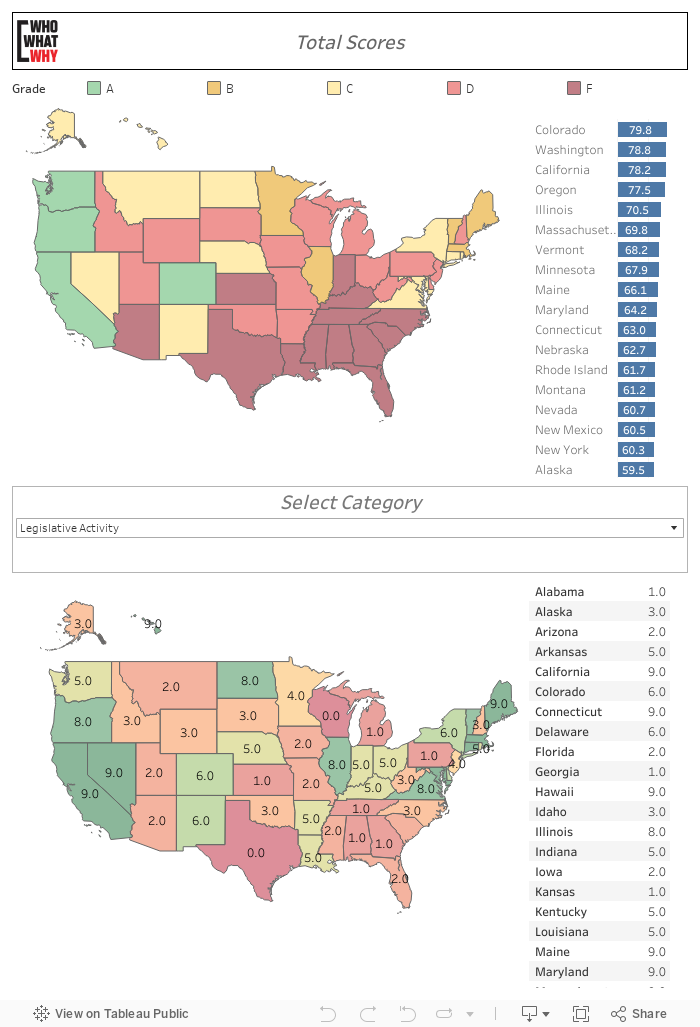
It’s our democracy and it’s in trouble — as is the electoral process at its heart. A glance at this interactive map tells the story:
This may not be news to the more than two-thirds of Americans — Democrats, Republicans, and independents — who, by every measure taken of late, all harbor deep concerns about the future of our democracy.
But those concerns — and the distrust of election processes — are, in themselves, a big part of the problem and the crisis we’re facing. Democracies don’t survive when they lose the trust of their citizens.
As a news organization with our ear to the ground, we have of course been aware of the national mood and the disquiet, all along the political spectrum, as we approach a November election that many on both sides are characterizing as seismic and, indeed, existential — with the specter of 2024 waiting in the wings.

Moods and impressions are important, but we wanted to provide a more objective measure of our election processes and how democracy is faring as we go around the country from state to state.
So we created the accompanying US Elections Report Card — an interactive map — to pull it all together and paint both the big and the detailed picture.
Perhaps not too surprisingly, it is a grim one. Very broadly, we reached the following conclusions:
-
-
- Democracy is not thriving in America as a whole
-
-
-
- It is doing far worse in the red states and swing states where the Republican Party exercises control
-
The map above allows you to see at a glance each state’s letter grade and numerical score (on a 0-100 scale). Probing deeper reveals each state’s score in 12 principal measures of electoral and democratic function. Still deeper you find the sub-components (43 in all) of each of those measures, along with the data, sources, and legends explaining how they were translated into numerical scores.
Of course any such grading effort — alphabetical or numerical — is inherently reductionist. There’s only so much a single number can tell you about a complex reality. But as the numbers accumulate and aggregate, a picture is drawn that is clear enough to alarm. The preponderance of Ds (16) and Fs (13) — in spite of the fact that we graded on a generous curve — is cause for dismay.
The fact that among those 29 failing states only two are “blue” while 19 are “red” reveals a sharp partisan divide linking democratic process with electoral product.
Even more disturbing — from a national perspective — are the remaining eight “purple,” or swing, states that pulled failing grades, all of them with legislatures under full Republican control and five of them also sporting Republican governors. It is in these states that presidential elections are decided, along with most of the competitive Senate seats.
In many cases, precise gerrymandering of state legislative districts — one of our 12 principal measures — serves to lock in those governing majorities, which are then empowered to further tighten their grip via attacks on voter participation, weak and ineffective audits, legislative rejection of ballot initiatives, and a variety of other anti-democratic provisions.
It’s a vicious cycle and it’s none too subtle. The upshot for national politics is hard to miss.
There are some bright spots:
States that…
-
-
- Mail ballots to every registered voter;
- Provide enough polling locations and drop boxes that voters without vehicles will not be at a loss;
- Use hand-marked paper ballots for their able voters so as not to choke off the flow of voters into lines around the block;
- Mandate risk-limiting audits prior to certification of winners;
- Remove the carve-up of districts as much as possible from partisan control by entrusting the process to nonpartisan commissions;
- Protect their election workers.
-
There were four As and five Bs, and these states — and the scattered positives among the rest — point the way to a fairer electoral process and a more sustainable democracy. Both are achievable. But the trend — certainly in the many failing states — is retrograde, and indicates that these are not their goals.
There is, indeed, a vacuum at the state level, when it comes to elections and the democratic process, that only federal legislation can fill. Democracy-protecting bills have been introduced; several have passed the House only to be killed by Senate filibusters.
That power is, at least in part, fruit of the poison tree of state-level provisions regarding the conduct of elections. So, for that matter, is a US Supreme Court that has gone after democracy-upholding provisions like campaign finance laws and the Voting Rights Act with both scalpel and hatchet.
The bottom line is our map full of Ds and Fs — and sounds an urgent call to fix this while it may still be fixable. We have a problem, America. A big problem.
You can view the data we used when calculating individual state grades here.
You can read about our methodology and a detailed report of our conclusions here.


