
It’s quite possible that the most reliable pollsters — “correcting” for their big collective misses in 2020 and 2016 — are significantly overestimating Trump/GOP strength now in 2024.
|
Listen To This Story
 |
Early last November, a poll came out that jaw-dropped just about everyone I know. It was from the highly regarded New York Times/Siena College shop and it showed Donald Trump beating Joe Biden by meaningful margins in five of six swing states surveyed, as well as a growing and potentially fatal weakness for Biden among key Democratic constituencies: voters of color and the young.
The dropping of that first shoe occasioned my initial column in what I promised would be a series: “Polling 101: Clearing Up Some Misunderstandings.” I hope you can take the time to review that piece, as it will provide important background and context for this next, long-delayed installment, which goes in a different and, as you’ll see, more controversial direction.
To summarize very briefly, in “Polling 101” I explained the surprising predictive power of statistical sampling; looked into some of the non-statistical factors that contribute to polling error and are difficult to quantify; described how pollsters use weighting protocols to address and mitigate such problems; cautioned against over-reliance on any given individual survey; and gave a (partial) vote of confidence to polling in the aggregate (i.e., the running averages you get from such as FiveThirtyEight and RealClear Politics), especially when the component polls are vetted, graded, and given weight accordingly by a trusted aggregator.
The upshot was a warning not to dismiss polling showing Biden’s weakness and Trump’s strength — if that pattern persisted over time, and in surveys from many different reputable shops.
Well, it has persisted — as of this week, pre-debate disaster, Nate Silver’s sophisticated Silver Bulletin model gave Trump a roughly 2 out of 3 chance of winning the Electoral College, and the latest Times/Siena dropped shoe had Trump up 6 points nationally among registered voters — and the “How is this effing possible?!” hand-wringing among Democrats, media, and all who fear the acid bath into which a second Trump presidency threatens to plunge our democracy has intensified accordingly.
But at the same time, Democratic candidates and progressive ballot measures did very well in last November’s off-year elections, as well as in the scattering of special elections held in 2023 and so far in 2024. We have seen Democrats underperform in the opinion polls and overperform at the polling place, in a pattern that has been remarkably consistent.
Which must lead one to ask: What is behind this divergence? What, if anything, can it tell us about the validity of the polls? And what, if anything, does it mean for what to expect this November?
The Science and Art of Modern Polling
I spent some years as a polling analyst and know the profession and a few of the mad fools who practice it. It is a science, but there’s also quite a bit of art to it. Because you can’t now, if you ever could, just go out and take a perfectly random sample of a target population (e.g., residents, registered voters, likely voters, etc.), the way you could, say, of a box of a million different colored marbles. Too many things get in the way, including differing levels of access to different demographic groups and a problem known as response bias among those survey participants you do reach.
As I detailed in “Polling 101,” pollsters deal with such problems by weighting their samples, which entails counting the responses from certain demographic groups more heavily (i.e., greater than 1.0) and others less heavily (i.e., less than 1.0).
That is where the art comes in. Because weighting a sample by such factors as race, age, gender, education level, geography, and partisanship comes down to a highly informed guesstimate of what the electorate will ultimately look like — that is, who will turn out to vote.
This is, as you might imagine — and even with the aid of Big Data and lots of computing power — tricky. Errors and unintended biases are inevitable. And if your weighting factors are off, odds are your poll will be off.
Fighting the Last War: Error Correction and its Pitfalls
One very important thing to recognize about the polling industry is that honest pollsters (i.e., those without an agenda) are fanatical about error correction. Their business model more or less precludes being chronically wrong, especially if it’s consistently in the same direction.
Which means, in a sense, that they’re always fighting the last war. They base their “corrections” (i.e., new weightings) on a lot of factors (i.e., data), but prominent among these factors are the vote counts for the previous election and how “off” from those percentages they and other pollsters were.
This makes all kinds of sense: If your last shot hit the front rim, you give it a little more; if it clanged off the back rim, a little less.
But it also means that if there was an unacknowledged “problem” with that election (or the ones preceding it) — say, the effects of voter suppression, or mistabulation or, god forbid, foreign interference — such that a significant number of voters thought they were voting one way or intended to vote one way (which they expressed to pollsters) but the vote counts strayed from that collective intention, then, next time around, the pollsters will be unknowingly correcting to a distorted baseline. As if someone had moved the basket.
One reason Trump’s odious Stop the Steal caught on is that we really don’t know for sure what’s happening in the pitch dark of cyberspace where our votes go to be counted, so there have long been grounds for skepticism about that part of the process, a legitimate skepticism finally weaponized with bad intent by Trump.
Of course we understand that all pre-election polling, even the best, can do no better than to reflect intentions, of which it is said the road to hell is paved (I will examine exit polling in this series’s next installment).
When a registered or likely voter responds to a poll, they are expressing their voting intentions — at the time. A lot can happen to those intentions before they finally vote, those votes are tallied, and the results take their place as factual record.
The Impact of Voter Suppression — and Worse
Of course the respondent — that is, the voters he or she is representing — can change their mind, move, die, be incapacitated, or decide not to vote (that’s one reason why polls months out should be taken with at least a grain of salt).
But they may also try to vote as intended and be thwarted. Because there are a lot of black holes their good intentions may fall into — especially if they are Black. And especially where they are vulnerable to targeted voter suppression tactics (virtually all of which are GOP specialties):
- They may have been purged from the voting rolls.
- They may wind up on a three-hour line and have to leave.
- They may have their eligibility or identity challenged and have to vote a “provisional” ballot (often uncounted).
- Their mail-in ballot may be “lost” or slow-walked by Louis DeJoy’s USPS.
- Their signature may be challenged and their ballot disqualified.
- They may be targeted by disinformants, pointing them to the wrong polling place or telling them Election Day is Wednesday.
- They may be (falsely) threatened with arrest if they can’t produce papers proving their citizenship.
- They may be intimidated by “poll-watching” vigilantes.
That’s quite a minefield for aspiring voters to traverse. Then, assuming their vote is successfully cast as intended, comes the covert part — where we trust voting computers to record and count as cast, often with no — or inadequate — verification.
So, let’s say that one or more of these factors intercede between the opinion polls and the actual votes cast and counted. Say, for example, such factors manifested in a “red shift” of 5 percent in 2014 — because, just spitballing here, some operative found a way to make the vote counts come out 5 percent more Republican than what voters had told the pollsters.
The next midterm election after 2014 is in 2018. Pollsters tweak their weightings for a presidential election based on the vote counts and poll-vote count shifts in previous presidential elections and likewise use prior midterm elections as their model for the current midterm election. They do this because midterm and presidential electorates consistently differ from one another in size and makeup, and you wouldn’t want to use apples to weight oranges.
So, come 2018, the pollsters “correct” their 2014 “error” (which, in fact, wasn’t their error) by weighting 5 percent to the right. There are a lot of ways of getting this done: A very modest over-representation of white voters, male voters, rural voters, less educated voters, and/or of course just plain old Republican voters will do the trick.
But what if in 2018 — stay with me here — said operative decides to sit the election out (perhaps in a fit of pique, like Achilles in the Iliad) and doesn’t work whatever voodoo magic he worked in 2014, so the vote counts are “pristine,” no red shift?
All else being equal, the pollsters who have corrected for their 2014 “error” will now be “off” in the opposite direction and we’ll see a “blue shift” — vote counts to the left of the polls. The poor pollsters get fooled because their assumption of an unimpeachable baseline in 2014 was erroneous.
This is the essence of what I have elsewhere described as an insidious vote count-poll feedback loop. Pollsters rely on past elections to model their weightings for current elections, on the ironclad assumption that those past vote counts were trustworthy and any disparity between their polls and those counts was their fault, so their model must be “corrected.”
If they do suspect that any prior election(s) on which they base their models were subject to interference — whether voter suppression or something more covert — they are likely to proceed on the assumption that the same or similar forces will be at play in the current election, and factor them in accordingly.
In other words, they take even suspect vote counts at face value and, if interference comparable to whatever occurred in the past occurs again, their polls, having in effect accounted for it, will be — mirabile dictu! — accurate.
Keeping Up With the Red Shift
Now I’m not saying our elections are rigged — though the statistical forensics since 2002 are, at the very least, concerning. But there are all sorts of games played to drive and suppress turnout, with varying impact — that is no secret. And I hate to say this, but one reason Trump’s odious Stop the Steal caught on is that we really don’t know for sure what’s happening in the pitch dark of cyberspace where our votes go to be counted, so there have long been grounds for skepticism about that part of the process, a legitimate skepticism finally weaponized with bad intent by Trump.
After the implementation of HAVA (the Help America Vote Act) thoroughly computerized our elections in 2002, the red shift — the one-way gap between the polls (tracking and exit) and the vote counts — was, for seven election cycles, pervasive. That’s not theory; it’s fact. We recorded consistent red shifts and virtually no blue shifts — ever.
This meant, by definition, that polls were off, election after election, in the same direction.
Pollsters ran themselves ragged trying to correct, but it was not enough (adding to the pollsters’ perplexity, the red shift tended to be significantly greater in competitive contests bearing national significance, which implied some kind of targeting).

The pollsters finally caught up in 2018, a year of intense inter-operative strife within the GOP camp. That election was also a record-breaking turnout outlier, boasting a huge jump in turnout relative to 2014 and all previous midterms (Trump being a turnout motivator for the MAGA base, and an even greater turnout motivator for the opposition), which pushed the results towards the Democrats.
But then “order” was restored in 2020, which saw record red shifts (pace Stop the Steal, the claims of which went against literally every bit of statistical forensic evidence).
If whatever caused the big red shift in 2020 goes away such that in 2024 the vote counts more faithfully reflect voter intent (what they tell pollsters), then the pollsters, pretty much across the board, will have overcorrected and the results in November will be a very pleasant surprise for Biden and the Democrats.
In the 2022 midterms, the pollsters achieved remarkable accuracy (as FiveThirtyEight maintains). But, for pollsters, Election 2024 is modeled on 2020 rather than on 2022 — presidential to presidential. So the pollsters’ natural response to their egregious 2020 error (among other embarrassments, the polling consensus had Biden winning nationally by over 12 million votes rather than 7 million, and the Democrats gaining rather than losing upwards of a dozen seats in the House), on top of their 2016 error (see Code Red, Chapter V), has likely been to weight several points to the right.
They don’t come right out and tell you that, but “the secret’s in the sauce” and there are quite a few reliable ways to accomplish that rightward nudge — via demographic weightings, as I detailed above — without being obvious about it.
Correcting for a Dubious Correction
So — ta dah! the bottom line at last… It’s quite possible that the most reliable pollsters — “correcting” for their big collective misses in 2020 and 2016 — are significantly overestimating Trump/GOP strength now in 2024.
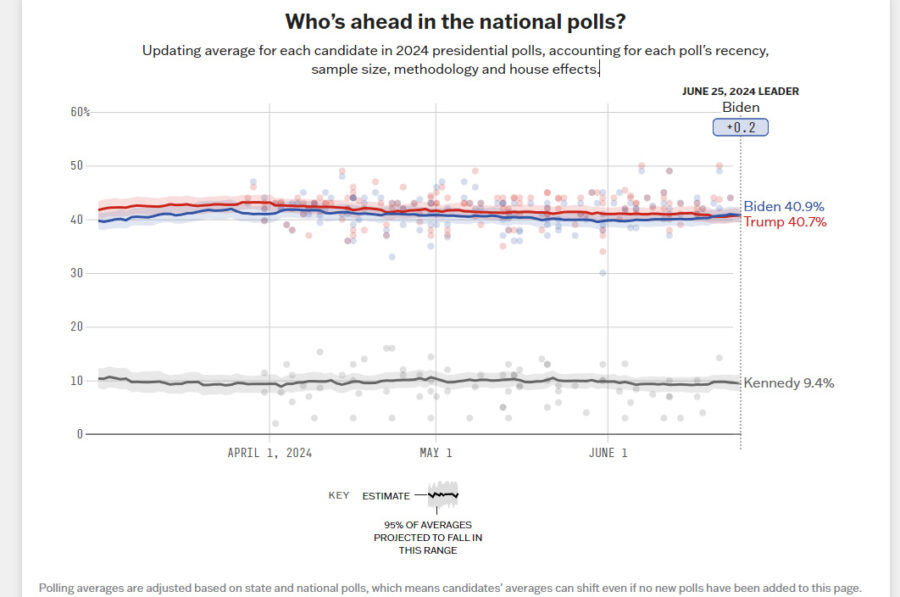
This year’s polls, when aggregated, can certainly be relied upon to show needle movement (e.g., response to Trump’s felony convictions or, as we’ll see soon enough, the debate), but the whole frame — including the super-stable national dead-heat, depicted in this “flat-line” chart from polling aggregator FiveThirtyEight, and the Trump swing-state advantage that the polls have shown for months — may be shifted several points in Trump’s favor by the pollsters’ “last-war correction.”
If whatever caused the big red shift in 2020 goes away such that in 2024 the vote counts more faithfully reflect voter intent (what they tell pollsters), then the pollsters, pretty much across the board, will have overcorrected and the results in November will be a very pleasant surprise for the Democrats (assuming the polls do not turn out to be a self-fulfilling prophecy by stoking stay-at-home despair on the left).
That is ground, I suppose, for “hope.”
But before anyone waxes too optimistic, I must point out that there are no grounds for assuming that whatever forces produced the massive 2020 red shift won’t be active this November.
In fact, as we have reported, the GOP has turbocharged its voter suppression game wherever it has the political and/or judicial power to do so, which includes just about every red state and several of the swing states into the bargain. Louis DeJoy still runs the Postal Service. And — although just about no one seated at the non-MAGA adult table will go there, for fear of further fueling Trump-driven election denial — the computers we trust to do the counting are still in large part faith-based black boxes.
If the polls are painting a distorted picture of America, who is to say that — given ramped-up voter suppression, Trumpian projection, and voting equipment vulnerabilities — the election itself won’t match (or worse) that distortion? Which would make those “How is this effing possible?!” polls, well, “correct.”
Next: The special challenges and utility of exit polls.


