
Saturday Hashtag: #MathsDontCare
Welcome to Saturday Hashtag, a weekly place for broader context.
|
Listen To This Story
 |
Forget politics for a minute, while everyone battles over party lines, the hard economic maths reveal a stark reality few are willing to confront: Over the past fifty years, most Americans have been left in the financial dust, while the richest raced ahead.
Income Share Shifts Over 50 Years
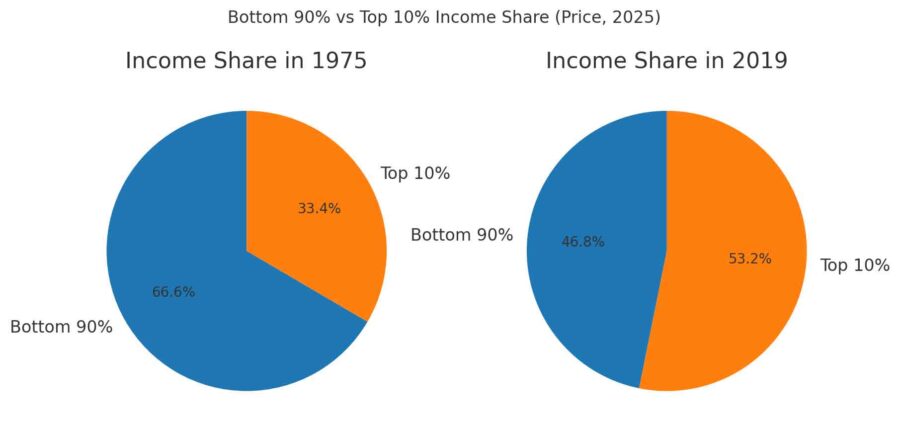
According to a RAND study, in 1975 the bottom 90 percent of Americans earned 66.57 percent of total taxable income. By 2019, that share had shrunk to 46.83 percent.
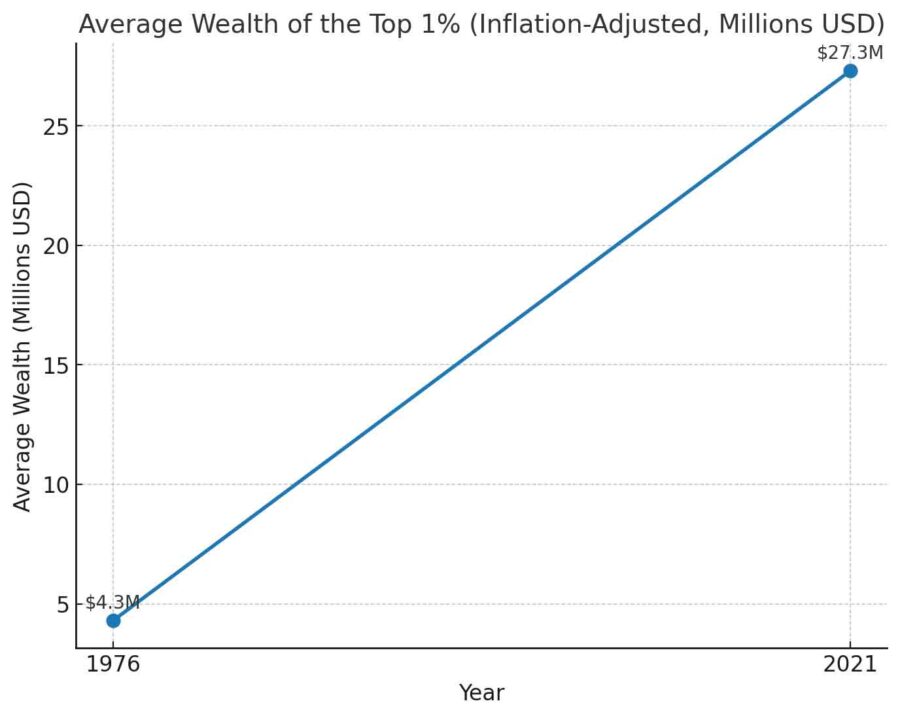
Meanwhile, according to Real Time Inequality the average wealth for the top 1 percent rose from $4.3 million in 1976 to $27.3 million in 2021 — an estimated 535 percent nominal increase. Adjusted for inflation, the estimated 27 percent gain still reflects dangerously destabilizing wealth concentration at the top.
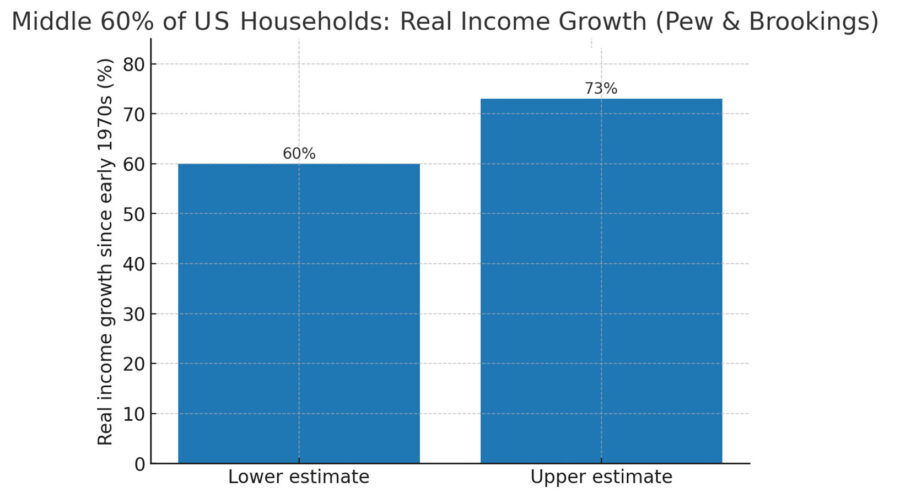
The middle 60 percent of households, the core of the workforce, only saw 60 percent real income growth over the same period (per Pew Research Center and Brookings Institution estimates).
Corporate Tax Cuts Didn’t Help Workers
President Donald Trump’s 2017 corporate tax cuts slashed the rate from 35 percent to 21 percent, costing $1.3 trillion over a decade.
They were sold as wage boosters, with promises of a $4,000 raise per household. In reality, the results fell far short. According to MarketWatch, real median wages grew only 0.09 percent faster in the two years after the cuts than before, a negligible change.
Research from the Joint Committee on Taxation found the tax cut’s gains went mostly to top earners, workers below the 90th percentile saw no wage boost. Instead, corporations funneled most of the gains into buybacks and dividends, for which S&P 500 firms spent over $6.4 trillion from 2018–2022 — more than on labor, infrastructure, or R&D (research and development).
Only about 20 percent of the tax-cut windfall went to capital or R&D, per IMF (International Monetary Fund) data cited by The Center on Budget and Policy Priorities. The rest fueled shareholder payouts. Buybacks jumped 55 percent in 2018 and are set to surpass $1 trillion in 2025.
Corporate case studies make the picture clearer:
- PepsiCo gave investors almost $21 billion in 2021, 2022, and 2023 combined, while raising prices for consumers and laying off workers.
- Comcast returned almost $43 billion to shareholders in 2021, 2022, 2023 combined while cutting 1,000 jobs and raising broadband rates.
- UnitedHealth rewarded shareholders with almost $15 billion in 2023 while boosting profits by denying 33 percent of claims.
The Real Cost of Living Has Exploded
While incomes have lagged, the price of essentials has soared:
- New cars: The average price has more than doubled since the 1970s, from about $26,100 in 1972 (inflation-adjusted) to over $48,000 in 2022.
- Housing: Adjusted for inflation, US home prices have risen about 170 percent since the early 1970s, making them roughly 2.7 times more expensive today (FRED/ BIS data).
- College: The cost of a four-year public degree (tuition, fees, room, board) rose from $10,231 in 1980 to $28,775 in 2019, an increase of about 180 percent. Some analyses show total college costs have risen over 700 percent since the 1960s.
Add in surging health care, food, utilities, and child care costs, and American prosperity has become a bridge too far for everyone but the very top of the food chain.
False Hope and Misplaced Blame
Some defend policies that deepen inequality, driven by blind political loyalty or the fabricated myth that hard work permits entry to the top 1 percent. But the reality is clear according to the data: nearly 99 percent of Americans will never achieve lasting prosperity.
For those earning the average of $62,000, the explosive wealth amassed by the top 1 percent starkly contrasts with stagnant wages, soaring living costs, and shrinking opportunities, revealing a flawed economy designed to enrich the ultra-wealthy while abandoning everyday workers.
What You Can Do:
- Learn the facts and share them.
- Find your lawmaker.
- Support candidates pushing for broad-based economic reform.
- Advocate for stronger labor rights and unions.
- Push for corporate accountability, transparency, and fair taxation.
- Demand affordable education, housing, and health care.
2025/2030 Income Tiers and Measures of Income Inequality
From Esri: “Household income survey data is commonly reported as an ordered categorical distribution, along with summary measures of median and average household income. These summary measures provide a description of an area’s income profile but give limited information about the shape of the income distribution. The shape, or dispersion, of this data is what can be quantified to define levels or degrees of income inequality. Fundamentally, income inequality measures the disparity of incomes across households. To better characterize and compare income distributions, Esri has quantified lower, middle, and upper tiers of households by income and provided a full suite of income inequality measures.”
‘It’s Harsh. It’s Mean, Brutal’: Trump Bill to Cause Most Harm to America’s Poorest
The author writes, “Last November, Donald Trump made a solemn vow to all Americans: ‘Every citizen, I will fight for you, your family and your future every single day.’ Eight months later, Trump is vigorously backing many policies that will mean pain for millions.”
10 Million Americans Will Go Uninsured Due to Trump Tax and Spend Law, CBO Estimates
The author writes, “Ten million more Americans will be uninsured in the next decade due to changes in President Donald Trump’s tax and spend law, according to an estimate by the Congressional Budget Office. The nonpartisan CBO analysis comes after the legislation became law in July and is an update from a previous analysis that estimated almost 11 million Americans would be uninsured from previous versions of the legislation.”
The Era of Big Raises for Low-Paid Workers Is Over
From The Wall Street Journal: “Something remarkable happened in the years immediately preceding and, especially, following the pandemic: Wages for poor workers began rising much faster than they did for the rich. That era may have now come to at least a temporary halt. And with worries about the health of the job market heightened following the disappointing July jobs report, it may have ended altogether.”
The Economic Party Rolls on for the Rich. For Everyone Else, Not So Much
The author writes, “Rich Americans are spending at a higher rate this year — everyone else is basically slowing their roll. Why it matters: New data makes clear that while the good times continue for higher-income earners — strong wage growth, less debt — lower-income Americans are under increasing financial stress.
The Impact of Living Paycheck to Paycheck: Shorter Lives, More Stress
From the US Senate Health, Education, Labor and Pensions Committee: “The massive income and wealth inequality in our country is not just an economic issue. The widening gap between the wealthy and the working class is a major factor in determining whether you will live a long and healthy life or whether you will live a much shorter life filled with stress, anxiety, depression, fear and significant health problems. The reality is that millions of working-class people in America are dying much earlier than they should. While life expectancy has steadily increased for the wealthiest in America, low and middle-income people have seen little to no gains. The result? A staggering gap in life expectancy between the wealthy and everyone else.”
From 2021: A New Approach to Measuring Income Inequality Over Recent Decades
From the RAND Corporation: “In a 2020 RAND Corporation study, RAND researchers developed a new method to measure income inequality. They found that, had income for workers below the top 10 percent of the income distribution grown at the same rate as the overall economy since 1975, workers in that group would have collectively earned $2.5 trillion more in 2018, 67 percent higher than their 2018 earnings. Furthermore, over the 43-year period from 1975 to 2018, the population below the 90th percentile would have earned $47 trillion more had their incomes grown at the pace of overall per capita economic growth.”
From 2019: Why The Tax Cuts And Jobs Act (TCJA) Led To Buybacks Rather Than Investment
The author writes, “The underlying logic for the TCJA was that allowing companies to keep a greater share of profits, would stimulate investments in long term growth. Instead, the dominant company response to the TCJA was stock buybacks. For the first three quarters of 2018, buybacks were $583.4 billion (up 52.6 percent from 2017). In contrast, aggregate capital investment increased 8.8 percent over 2017, while R&D investment growth at US public companies increased 12.5 percent over 2017 growth.”


