US debt is out of control. Government debt is more than the total GDP, and individual Americans are burdened by mortgage, student loan, and credit card debt, while seeing little improvement in their wages. Can the course be corrected?
Debt is back in the news. Last month, with the US close to exhausting the $19.8 trillion limit on what it could borrow, Congress voted to raise the debt ceiling. But that was just a short-term fix. Lawmakers will have to tackle debt and federal spending again in December.
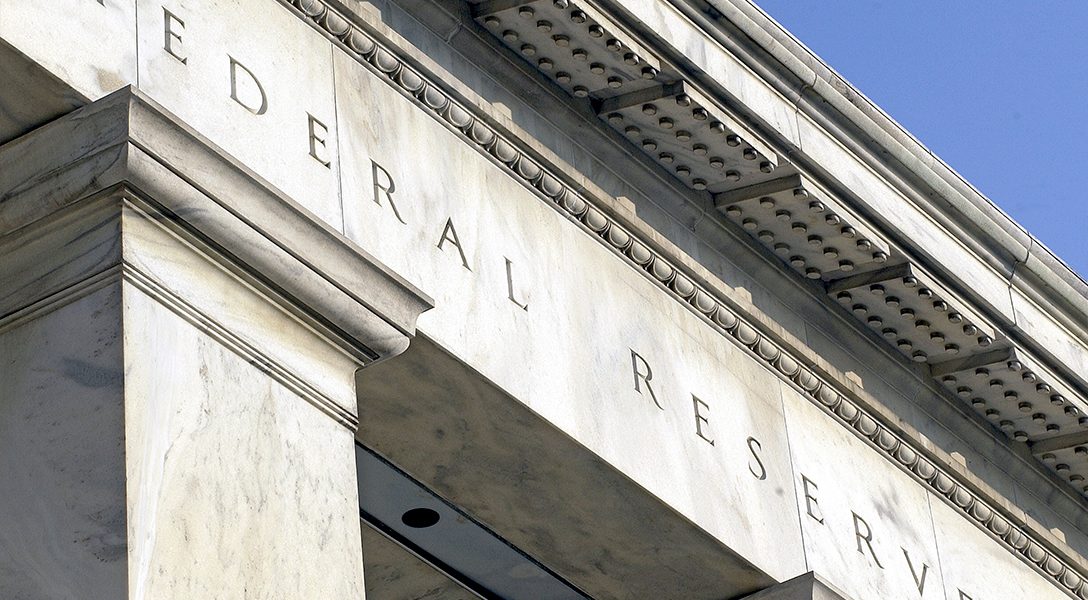
Government debt isn’t our only problem. The Federal Reserve Bank of New York reported that the nation’s total household debt has reached a new peak, at $12.8 trillion. And German finance minister Wolfgang Schaeuble recently warned that escalating worldwide debt levels could trigger a global financial crisis.
Such news naturally conjures memories of the financial meltdown a decade ago, when a similarly debt-laden economy collapsed. So are we doomed to reprise the Great Recession of 2007-8?
The answer is certainly Yes, if we have to rely on reining in government debt in order to avert a new meltdown. Federal government debt — mostly in the form of Treasury bonds sold to individuals, institutions, and other nations — has been growing out of control for 30 years.
In 1985, the debt ceiling was less than $3 trillion. Although our population increased by only a third since then, from about 240 million to 325 million, government debt in the same period rose more than six times.
As Mr. Micawber advised David Copperfield in the Dickens novel: “Annual income twenty pounds, annual expenditure nineteen and six [pence], result happiness. Annual income twenty pounds, annual expenditure twenty pounds ought and six, result misery.”
By the end of 2007, when the Great Recession hit, government debt had already risen to $9 trillion. It has now more than doubled in the ten years since. And it continues to worsen daily. On September 8, for the first time in US history, government debt exceeded $20 trillion, and by October 5, it was $20.4 trillion. That innocent-looking “.4” means that the government borrowed an additional $400 billion in less than a month.
To put the $20.4 trillion in context, it is equal to 104% of our Gross Domestic Product. GDP is a globally agreed-upon measure of a nation’s whole economy. It represents the total value of all the transactions on which a government can levy taxes — retail sales, personal incomes, airline tickets, etc.
Government revenue comes from either taxes or borrowing, and neither source is limitless.
When borrowing grows rapidly and steadily over decades, with new borrowing paying off old debt, the nation’s lenders get anxious. Eventually, they want to see some debt paid down, i.e., some Treasury bonds retired without new bonds being sold.
To retire those bonds, the government has the following choice to make: raise taxes or reallocate funds by cutting existing government programs.
Taxation, however, is limited by the size of the economy, or GDP, and by how much of their income US citizens — and by extension corporations, whose money/political speech is so influential — are willing to give up to the tax collector before voting an administration out of office.
Small increases in taxes — a few more pennies on a gallon of gasoline, for example — may go unnoticed by most citizens, but the small additional amounts collected in that way will not satisfy lenders’ expectations for major debt reduction. Fundamental restructuring of the tax code, including capturing additional revenue from wealthy corporations and individuals, would be required — an outcome not likely under the current congress and administration. Indeed, the White House is touting a plan to drastically cut corporate and individual taxes, with most of the benefits going to the nation’s wealthiest taxpayers.
Alternatively, cutting government programs and functions to reallocate the money towards paying down the debt seems like a non-starter. In general, Republicans are unwilling to cut from military spending, while Democrats don’t like to see social, environmental, or entitlement programs touched. And recent natural disasters are also making demands on the federal purse.

Photo credit: Jeremy Brooks / Flickr (CC BY-NC 2.0)
A nation’s credit rating, i.e., the willingness of lenders to continue lending to it, is directly affected by its ratio of debt to GDP. We have already seen the credit ratings of several American states lowered — costing them more in interest payments on the new bonds they sell — because their debt outgrew their tax base. (Illinois and New Jersey are egregious examples.)
The same thing happens internationally. According to the Organization for Economic Cooperation and Development, which counts the US (and all other major industrialized countries) among its 35 members, the maximum a prudent debt-to-GDP ratio should reach is between 70% and 90%.
With the US ratio already at 104%, international concern might reasonably be voiced about the safety of US Treasury bonds under the current administration. And that could lead to widespread dumping of Treasury bonds and US dollars, and a collapse in their values.
Unfortunately, no one in Washington today is paying attention.
If the outlook for government debt bodes ill for the economy in coming years, can we take any comfort from the state of household debt? The answer is, Yes and No.
…it was only in the 1980s that American households began to “leverage” their income, i.e., to borrow more money than they could pay back out of income.
Total household debt today — at $12.8 trillion — is $2 trillion greater than it was in 2007. Nonetheless, households are (by some measures) in less dire straits than they were. One measure is the ratio of household debt to household income, which has come down from a peak of 133% in 2007 to 100% today.
That ratio is as important for households as debt-to-GDP is for governments, because the money from income must pay all household expenses before the household can decide whether to take on any debt at all.
At least, that was how Americans used to think. As Mr. Micawber advised David Copperfield in the Dickens novel: “Annual income twenty pounds, annual expenditure nineteen and six [pence], result happiness. Annual income twenty pounds, annual expenditure twenty pounds ought and six, result misery.”
“U.S. household leverage, as measured by the ratio of debt to personal disposable income, increased modestly from 55% in 1960 to 65% by the mid-1980s. Then, over the next two decades, leverage proceeded to more than double, reaching an all-time high of 133% in 2007.”
For most Americans, in fact, debt was unknown before the 1980s. When this writer was in college, in the 1950s, no one graduated owing money to a financial company. We had scholarships and we had opportunities to work, and college tuition was more modest, so the concept of “student debt” did not exist.
Nor did we have credit cards, which began to proliferate only in the 1960s. Financial institutions aggressively marketed the cards, even to individuals with poor credit ratings, offering them credit at high interest rates.
As for long-term home mortgages, which accounted for most of the growth in household debt in recent decades, these were first used in the 1950s, during the boom in housing construction that followed World War II.1
Something fundamental changed between then and now in attitudes toward debt. The full extent of what happened was detailed in a 2009 report from the Federal Reserve Bank of San Francisco: “U.S. household leverage, as measured by the ratio of debt to personal disposable income, increased modestly from 55% in 1960 to 65% by the mid-1980s. Then, over the next two decades, leverage proceeded to more than double, reaching an all-time high of 133% in 2007.”
In other words, it was only in the 1980s that American households began to “leverage” their income, i.e., to borrow more money than they could pay back out of income.

Photo credit: Quinn Dombrowski / Flickr (CC BY-NC 2.0)
Although the overall debt-to-income ratio has improved since 2007, as we’ve seen, some changes in the components of household debt are worrisome. In particular, student debt has more than doubled since 2006, to $1.3 trillion, while tuition costs have continued to skyrocket. And that will be a drag on new household formations — a major driver of economic growth — in coming years.
What’s more, student debt is now carried not just by young people but increasingly by people 60 years of age or older. In 2015, there were 2.8 million older Americans with student debt, up from 700,000 in 2005. Most of their debt, $23,500 on average, was acquired helping children and grandchildren pay for their education.
The huge growth in household debt-to-income since the 1980s occurred because households were repeatedly told that it was okay to take on debt without considering their incomes, “because assets and household net worth were rising.”
For many members of the baby-boomer generation, that debt is now an additional burden, even as they find that inadequate private pensions leave them relying primarily on Social Security benefits for their living expenses.
Also worrisome is the fact that most of the growth in household debt in the past two decades has occurred among middle-class and poorer households.2 So debt is held disproportionately by the same households whose share of national income has been shrinking. The longer those households take to reduce their debt, the greater the danger of a financial shock ushering in another great recession.
The most important question for the coming years, however, is whether Americans have learned the lessons of 2007 and will finally reject the notion that endless debt, both personally and nationally, can be a means for improving their lives. The huge growth in household debt-to-income since the 1980s occurred because households were repeatedly told by government and increasingly unregulated financial institutions that it was okay to take on debt without considering their incomes, “because assets and household net worth were rising.”
Greenspan mocked those who had earlier warned of too much debt. “I do not recall a decade free of surges in angst about the mounting debt of households and businesses,” he wrote. “Such fears ignore a fundamental fact of modern life: in a market economy, rising debt goes hand in hand with progress.”
The concept is simplistic. Of course a family feels more wealthy if its home and any investments it has are rising in value. Because family members are feeling flush, they may decide that this is the time to remodel a kitchen. Such foibles are human.
However, when such a foible is raised to the level of a principle by a prominent government official, and that principle is echoed by legions of financial practitioners, especially those who stand to benefit from the results, the situation can turn tragic.
The quote above about “assets and net worth” is taken from Alan Greenspan’s memoir, The Age of Turbulence (p 346). Greenspan was appointed by President Ronald Reagan as Chairman of the Board of the Federal Reserve System in 1987, and was reappointed by the next three presidents. He served for thirty years in all, until 2006 — the same period, as it happens, covered by the San Francisco Reserve Bank report.
What Americans should have learned from the Great Recession is that while debt — once taken on — doesn’t change, assets and net worth can both rise and fall.
Greenspan mocked those who had earlier warned of too much debt. “I do not recall a decade free of surges in angst about the mounting debt of households and businesses,” he wrote. “Such fears ignore a fundamental fact of modern life: in a market economy, rising debt goes hand in hand with progress.”
His assurance was cold comfort to 2.2 million Americans who faced foreclosure proceedings on their homes in the very year, 2007, that Greenspan’s book was published. Many more millions of foreclosures were begun during the following years.
What Americans should have learned from the Great Recession is that while debt — once taken on — doesn’t change, assets and net worth can both rise and fall. The average price of a house, the main household asset for most Americans, reached its peak in the first quarter of 2007 and then steadily fell by more than 20% over the next five years.
Furthermore, while average house prices nationally have recovered somewhat, another measure has not recovered, and that is the ratio of house prices to median household income.
Of course, that is a national average — which is skewed upward by wealthy areas of the country in which house prices stayed high. On the other end of the scale, the millions of Americans who lost their homes after 2007 saw house prices in their areas fall by 30%, 40%, or more.
Furthermore, while average house prices nationally have recovered somewhat, another measure has not recovered — the ratio of house prices to median household income. That critical measure fell by 30% from its peak in 2006 to its bottom in 2012; and, even after recovering somewhat, it remains at its 2002 level.
Why is this important? Because the excitement of feeling one’s wealth grow faster than one’s income has vanished, leaving a sense of stagnation. The American middle class is essentially back to where it was in 2002.
Despite the challenges they face, average Americans remain our best hope for avoiding another financial meltdown — through both their personal financial decisions, and their choices in the voting booth. The government’s debt-to-equity ratio, readily available on the websites of the Department of Treasury and Bureau of Economic Analysis, will likely worsen under the current administration from its current 104%. As it does, we can expect that the impatience of global lenders will lead to falling values for both Treasury bonds and the US dollar.
Perhaps the most telling indication of future trouble lies not in any single statistic, but in the continuing efforts in Washington to widen even further the financial gap between the wealthiest of Americans and the rest of us.
The government will then have to pay higher interest on its bonds and collect more from taxpayers to do so, imported goods will cost Americans more, and the burden will fall on average Americans.
As for the potential role of average Americans, even though their leverage has come down, it will have to come down further, to pre-1980s levels. If Americans can manage to live within their incomes and still pay down their debt, the improvement will become evident through continued lowering of the ratio of household debt to household income, available in the FRED data on the Federal Reserve Bank of St. Louis’s website.
Living within their incomes, however, will not be easy for average Americans, many struggling to get by. If their ratio of household debt to household income rises, it will be further warning that a financial meltdown is coming.
Perhaps the most telling indication of future trouble lies not in any single statistic, but in the continuing efforts in Washington to widen even further the financial gap between the wealthiest of Americans and the rest of us. That gap has been increasing for two decades, placing more money in the hands of people who want simply to accumulate still more, and less in the hands of those who will spend it immediately.
That imbalance has been plaguing the economy and hindering the recovery from the great recession of 2007. Unless an even greater imbalance is thwarted by a reconstituted Congress in next year’s elections, the plague will only worsen.
It could be a very bumpy ride for the economy over the next few years.
Endnotes
.
1. William W. Bartlett, Mortgage-Backed Securities, New York Institute of Finance, 1989.
2. Cynamon, Fazzari, Setterfield, eds, After the Great Recession: The Struggle for Economic Recovery and Growth, Cambridge University Press, 2013.
Related front page panorama photo credit: Adapted by WhoWhatWhy from roller coaster (Brandy Berthelson / Flickr – CC BY-NC 2.0) and eagle (JDB Sound Photography / Flickr – CC BY-NC-SA 2.0).


")